
In this report
The CDC’s newest national data give us a frustrating picture of physical activity among American high school students: progress is hard to find.
In 2025, just 25% of U.S. high school students reported being physically active for at least 60 minutes every day. Only 16% met both the aerobic and muscle-strengthening guidelines, and just 20% attended physical education every school day.
Looking across the full decade from 2015 to 2025, the CDC’s latest youth report found that four major measures of physical activity worsened. Sports-team participation was the lone exception.
I find that pattern more concerning than any single percentage. We aren’t looking at one unusually inactive class of teenagers or a temporary pandemic-era dip. Multiple indicators have moved in the wrong direction across a decade.
And one of the largest declines happened somewhere teenagers are already required to spend much of their day: school.
Four of Five Physical Activity Measures Got Worse
The CDC’s Youth Risk Behavior Survey tracks several behaviors rather than trying to reduce teenage activity to one number.
I like that approach because “active” can mean remarkably different things depending on how you ask the question.
Here is what changed between 2015 and 2025:
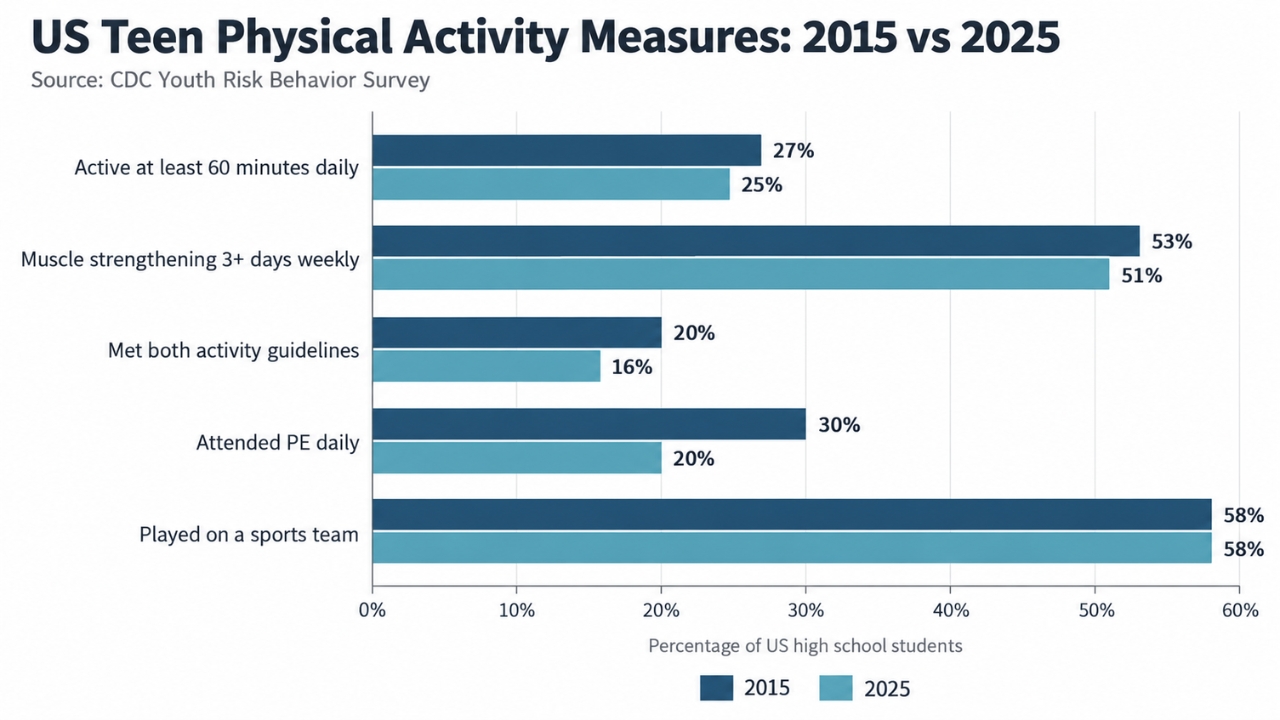
The CDC classified the first four as worsening 10-year trends. Sports-team participation showed no significant 10-year change.
A two-percentage-point drop in daily activity from 27% to 25% does not look dramatic on its own. That is exactly why I would not judge the trend by comparing two endpoints.
The CDC analyzed every survey cycle from 2015 through 2025 using regression models that accounted for sex, grade, and race and ethnicity.
In other words, its “worsened” classification reflects the pattern across the decade rather than somebody looking at 27 and 25 and deciding that two is a scary number.
Only One in Six Students Meets Both Guidelines
The number I find especially useful is 16%.
Federal physical activity guidelines recommend that children and adolescents ages 6 through 17 get at least 60 minutes of moderate-to-vigorous activity each day, with muscle-strengthening activity included on at least three days per week.
Adult heart-health exercise guidelines provide a useful comparison with the much higher daily activity target set for children and teenagers.
View this post on Instagram
In 2015, 20% of high school students reported doing both. By 2021, the figure had dropped to 16%, and it remained at 16% in both 2023 and 2025.
Put more simply, roughly five out of six high school students did not report meeting both recommendations in 2025.
That doesn’t mean five out of six teenagers never exercise. Far from it. The threshold is fairly demanding because students have to report 60 minutes of activity on all seven days and muscle strengthening on at least three.
Still, I don’t think that distinction makes 16% reassuring.
Fitness culture spends enormous amounts of energy debating ideal training splits, supplements, heart-rate zones, and whether three sets are superior to four.
Connected fitness is moving in the same direction, with new treadmill technology now built around pace targets, heart-rate zones, and running-form data.
Meanwhile, most teenagers aren’t reaching the basic population-level activity target in the first place. I find that gap considerably more important.
The Decline in Daily PE Is Hard to Ignore

Daily physical education produced the largest obvious change in the numbers.
In 2015, 30% of students attended PE five days during an average school week. In 2025, that figure was 20%. It had temporarily climbed to 27% in 2023 before dropping seven percentage points in just two years.
For me, this is one of the most consequential findings in the report.
Teenagers have different home environments, transportation options, neighborhoods, family schedules, financial resources, and access to sports.
School is one of the relatively few places where organized physical activity can reach a broad population regardless of whether somebody owns a treadmill, lives near a park, or has parents who can drive them to soccer practice.
The need for accessible physical education goes beyond exercise. CDC data show that nearly 40 million U.S. adults cannot swim, which raises serious questions about access to basic water-safety education.
That does not mean PE automatically solves teenage inactivity. A 45-minute class isn’t magic, and the survey measures attendance rather than how active students actually were during class.
Still, losing regular opportunities for movement at school is difficult to square with a national goal of getting adolescents to move more.
The return of the Presidential Fitness Test in 2026 raises a related question: Can schools improve student fitness through assessments without more opportunities for regular physical activity?
Sports Participation Rebounded, and That Is Good News

There is a genuinely encouraging number here.
The share of students who said they played on a school or community sports team during the previous 12 months rose from 52% in 2023 to 58% in 2025. That returned participation to the same level recorded in 2015.
A separate participation trend offers an interesting contrast. Americans ages 13–24 now have the highest pickleball participation rate of any age group, according to SFIA’s 2026 report. Yet greater interest in an individual sport does not necessarily translate into more daily physical activity across the entire teenage population.
I like seeing that recovery. Organized sports can provide exercise, structure, social interaction, skill development, and a reason to move that does not feel like somebody prescribed “physical activity.”
But I would resist turning the sports figure into evidence that the broader problem is fixing itself.
Nearly three in five students participated on a team, while only one in four reported 60 minutes of activity every day.
Those numbers can coexist quite easily. A student might play volleyball three days per week and be fairly sedentary on the others. Sports participation measures whether someone played on a team at any point during the past year. Daily activity measures what happened on each of the previous seven days.
They answer different questions.
Owning a jersey and moving for an hour every day remain, statistically speaking, separate accomplishments.
The Male-Female Activity Gap Remains Large
The 2025 results also show substantial differences by sex.
Among male students, 32% reported at least 60 minutes of activity every day. Among female students, the figure was 18%.
The gaps appeared across every physical activity measure included in the report:
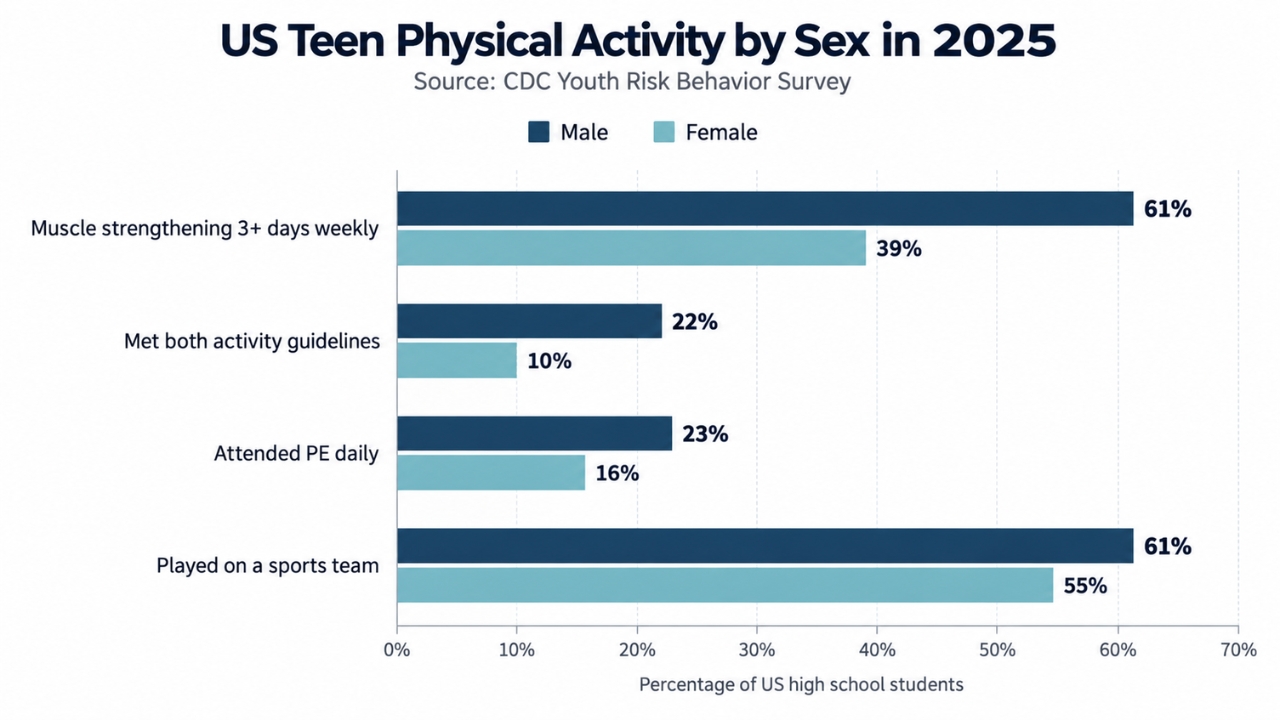
All of those differences were statistically significant.
The 32% versus 18% daily-activity gap stands out to me. That’s not a tiny demographic difference hidden several decimal places into a spreadsheet.
The survey cannot tell us why the gap exists, so I would be careful about assigning one explanation to it. Opportunities, sports participation, social environments, preferences, school programs, safety, transportation, and plenty of other factors can influence activity.
The useful question is not why teenage girls aren’t simply “trying harder.” Population data deserve better interpretation than that.
Rural Students Reported More Activity on Several Measures
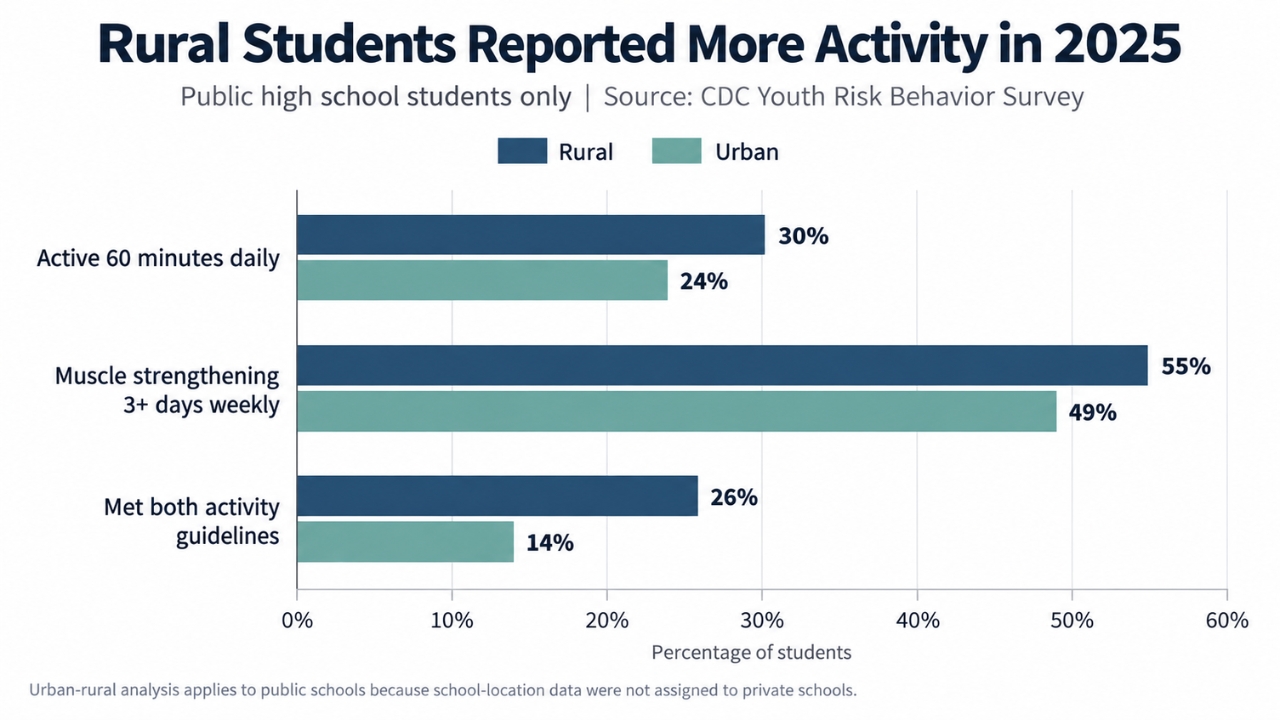
Another result I didn’t want to skim past involves geography.
Among students in public schools, 30% of rural students reported 60 minutes of daily physical activity compared with 24% of urban students.
Rural students were also more likely to report muscle strengthening, 55% versus 49%, and were much more likely to meet both guidelines, 26% versus 14%.
There is an important methodological detail here: the urban-rural analysis applies to public high school students because the CDC could not assign its school-location measure to students in parochial and other private schools.
I find the 26% versus 14% difference especially interesting, but I would treat it as something to investigate rather than an invitation to invent a neat story about rural lifestyles. The survey tells us where students attended school and how they reported their activity. It does not identify the cause of that difference.
How Much Confidence Should We Put in the Survey?

Whenever I see a national exercise statistic, I want to know who was actually measured.
The 2025 national YRBS used a three-stage sampling design intended to represent students in grades 9 through 12 attending public, charter, parochial, and other private schools across all 50 states and Washington, D.C.
After data cleaning, 10,710 questionnaires were usable. Responses were weighted to represent the national high school student population.
The data are self-reported, which matters.
Nobody followed 10,000 teenagers around with accelerometers. Students answered questions about activity during the previous seven days, including how many days they accumulated 60 minutes of activity and how frequently they performed strengthening exercises.
For context, 46% of U.S. adults now own a wearable device, but the CDC’s teen activity figures rely on survey responses rather than device measurements.
People are not famous for recalling physical activity with stopwatch precision. Teenagers have not somehow escaped that human tendency.
There is another limitation worth knowing: the overall 2025 survey response rate was 30.6%, based on a 47% school response rate and 65.2% student response rate. The CDC’s technical notes explain that weighting was applied to adjust for school and student nonresponse.
I would still take the trends seriously because the YRBS is a long-running, systematically conducted national surveillance program. I would also describe its findings accurately: they tell us what U.S. high school students reported, not the exact movement measured from every American teenager.
That distinction is small enough to disappear in headlines and important enough to keep.
The New CDC Report Also Gives Us a Narrower Picture
CDC’s Youth Behavior Survey Data Summary & Trends Report: 2013-2023 is available. Read the report: https://t.co/0UboePXmfZ #CDCYRBS https://t.co/UQlOCuQceV
— CDC’s Division of Adolescent and School Health (@CDC_DASH) November 29, 2024
There is some context around the release itself.
Stateline’s reporting on the release noted that the CDC’s 2025 Youth Health in Focus publication is considerably narrower than the national report released two years earlier.
The new publication concentrates on diet, physical activity, sleep, digital behavior, and mental health and suicide risk, while topics including substance use, sexual behavior, and several demographic disparities receive much less attention in the main report. Much of the underlying YRBS data remains publicly available.
That doesn’t invalidate the physical activity findings. It does mean readers should remember that a report’s highlighted findings are a selection from a much larger surveillance system.
I’ve spent enough time around datasets to know that what appears on page one and what exists in the data are not always the same thing.
The Bigger Problem Is Everyday Movement
My main takeaway from the 2025 numbers isn’t that teenagers need more intense workouts.
It is that everyday physical activity remains too uncommon, and several indicators have moved backward over a decade.
Sports participation has recovered. Muscle-strengthening activity has rebounded from its 2021 low. Those are worthwhile positives.
That youth trend stands in contrast to the broader U.S. inactivity rate, which has fallen to 18.7%.
Yet only 25% of high school students reported being active for 60 minutes every day, 16% met both major activity guidelines, and daily PE participation has fallen substantially since 2015.
The CDC points to school-based approaches that create opportunities before, during, and after the school day, including PE, classroom movement, walking and biking initiatives, activity clubs, intramural sports, and partnerships with families and communities.
That direction makes sense to me.
If we want population-level activity to rise, exercise has to fit into ordinary life for more teenagers. It cannot depend entirely on making a varsity team, having a gym membership, living next to a trail, or developing an unusual enthusiasm for burpees.
Planet Fitness offers one example of expanded access. Its free summer workouts for teens attracted approximately 3.7 million participants in 2026, although the average participant logged just 5.2 visits.
That contrast is especially interesting because U.S. gym membership reached a record 81 million people in 2025.
And frankly, I don’t think teenagers are the only population that would benefit from that lesson.